AI Benchmarks
This section provides the information and steps that we used to run some of the benchmarks on AiMOS.
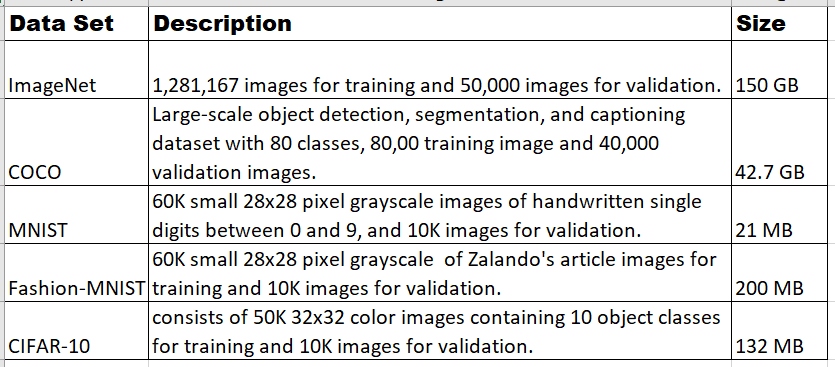
Common AI Datasets (CADS) Repository
This repository contains a set of open-sourced AI datasets are made available to AiMOS users. It is for the ease of access for benchmarking and experimentation.
If you are interested in having access to the repository, you need to place a request in your respective #aimos-xxx slack channel. You can request additional data sets to be placed in the repo. Requests can be placed in your respective slack channel.
The CADS repository is in directory: /gpfs/u/locker/200/CADS/datasets
Common AI Benchmarks (CABS) Repository
This repository contains sample scripts, experiment setup, datasets, etc, that were used to run the common benchmarks, such as ResNet-50, MobileNetV2, Fairseq, etc.
See the repository at: https://github.com/IBM-AI-Hardware-Center/AiMOS-CABS
Monitoring Tools
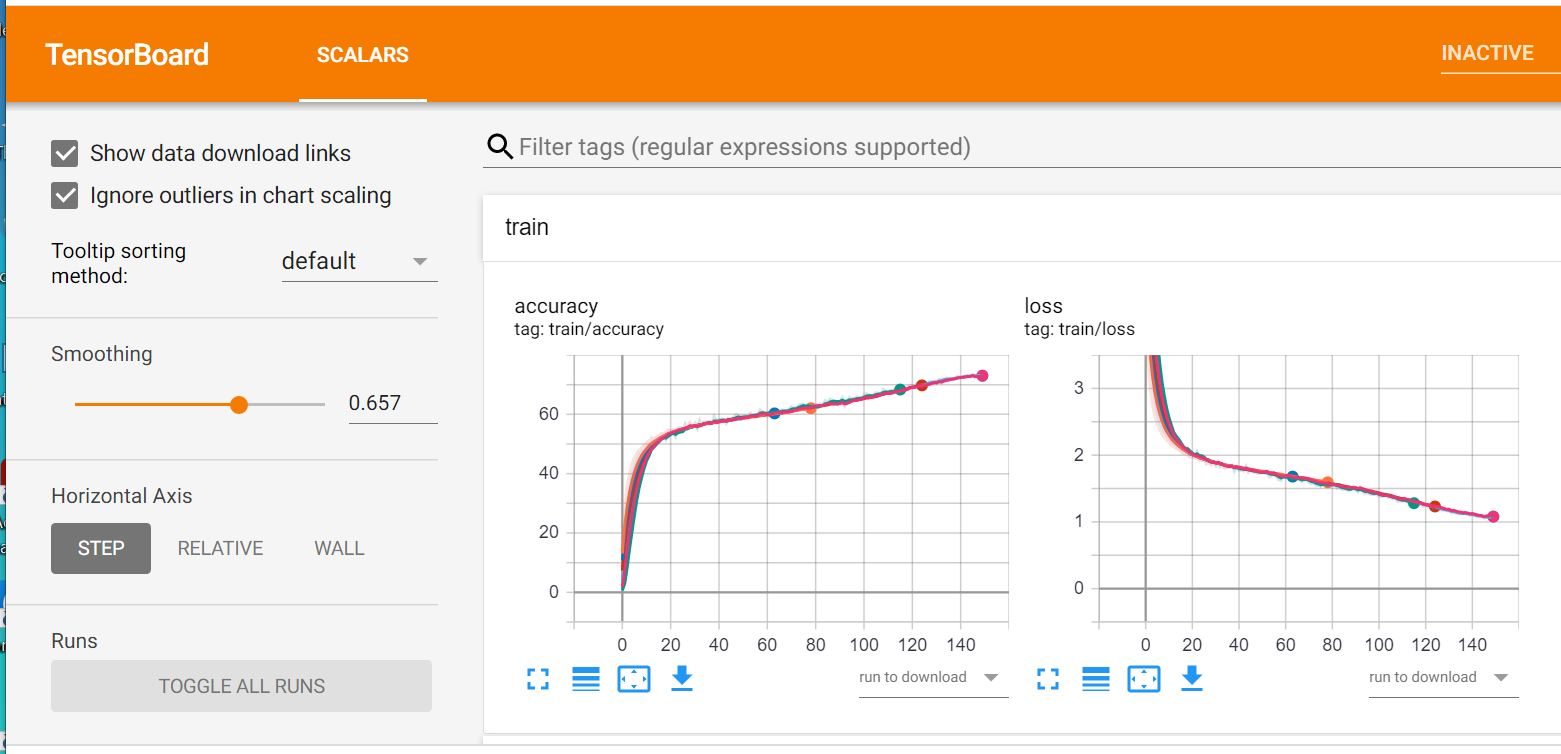
Tensorboard
Tensorboard is a data visualization toolkits for machine learning experimentation. For more information see https://www.tensorflow.org/tensorboard/get_started.
In order to use Tensorboard to visualize the data, you need to collect the data that you want to visualize. For Pytorch, you can use the integrated Tensorboard to collect Tensorboard data. For documentation, see https://pytorch.org/docs/stable/tensorboard.html. For tutorial, see https://pytorch.org/tutorials/recipes/recipes/tensorboard_with_pytorch.html
Code Snippets to collect the data
Define the directory to store the collected data.
parser.add_argument('--log-dir', default='./logs',
                 help='tensorboard log directory')
Import tensorboard class and set the logwritter.
try:
  from torch.utils.tensorboard import SummaryWriter
  log_writer = SummaryWriter(args.log_dir) if args.global_rank == 0 else None
except ImportError:
  log_writer = None
In the train loop, collect the data:
if log_writer:
  log_writer.add_scalar('train/loss', losses.avg, epoch)
  log_writer.add_scalar('train/accuracy', top1.avg, epoch)
In the validation loop, collect the data:
if log_writer:
  log_writer.add_scalar('val/loss', losses.avg, epoch)
  log_writer.add_scalar('val/accuracy', top1.avg, epoch)
You should see the collected data in the ./logs directory as defined above.
events.out.tfevents.1600877997.dcs049.ccni.rpi.edu.134021.0
events.out.tfevents.1600903856.dcs003.ccni.rpi.edu.42871.0
events.out.tfevents.1600904287.dcs026.ccni.rpi.edu.23978.0
events.out.tfevents.1600907411.dcs009.ccni.rpi.edu.16523.0
Visualize the data
Install tensorboard package if it was not installed.
conda install tensorboard
After tensorboard is installed, you start tensorboard to plot multiple experiments together, use –logdir_spec, for example:
tensorboard --logdir_spec="1node":/gpfs/u/home/BMHR/BMHRkmkh/scratch/mob2/logs/test_mobnetv2_1,"2nodes":/gpfs/u/home/BMHR/BMHRkmkh/scratch/mob2/logs/test_mobnetv2,"4nodes":/gpfs/u/home/BMHR/BMHRkmkh/scratch/mob2/logs/test_mobnetv2_4,"8nodes":/gpfs/u/home/BMHR/BMHRkmkh/scratch/mob2/logs/test_mobnetv2_8:"16nodes":/gpfs/u/home/BMHR/BMHRkmkh/scratch/mob2/logs/test_mobnetv2_16 --host "0.0.0.0" --port 6006
Or if you only have a single experiment, use –logdir, for example:
tensorboard --logdir /gpfs/u/home/BMHR/BMHRkmkh/scratch/logs/test_mobnetv2_2 --host "0.0.0.0" --port 6006
Now you can use ssh tunneling to display the graphs on your destop. For example:
[id@kvt-rhel ~]$ ssh -L6006:dcsfen01:6006 <your-id>@blp01.ccni.rpi.edu
Now point your brower to localhost:6006. For example:
http://localhost:6006
nvidia-smi
You can use nvidia-smi command to collect GPU data such as gpu utilization, memory utilization, power used, fan speed, etc.
For the list of valid properties to query for switch “–query-gpu=” see https://briot-jerome.developpez.com/fichiers/blog/nvidia-smi/list.txt
For example:
nvidia-smi --query-gpu=timestamp,gpu_uuid,pstate,temperature.gpu,utilization.gpu,utilization.memory,memory.total,memory.free,memory.used,power.draw,fan.speed --format=csv -l 10 |tee nvidia_2nodes.txt
Visualize the data
You can download a sample jupyter notebook “plot_nvidia-smi.ipynb” at https://github.com/IBM-AI-Hardware-Center/AiMOS and modify it accordingly to plot the data.